
Advertisement
FTCE General Knowledge Mathematics
This Test Tutoring Video provides an answer and explanation for Question 29 from our Version 1 Practice Test for FTCE General Knowledge Mathematics. It is part of our Free FTCE General Knowledge Mathematics Prep Course, which also includes longer "Core Videos" that go further in-depth and teach all the content knowledge you need for success on the exam.
Question 29 (V1)
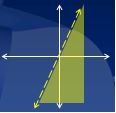
Which inequality represents the graph provided?
A. y < 2x
B. y > 2x
C. `y >= 2x`
D. `y <= 2x`
Answer & Explanation
Done watching this? Return to the course homepage to access your other free videos.
Return to Course HomepageAdvertisement
Video Transcript
Below is a full text transcript of our video above, which explains how to answer Question 29 from Version 1 of our FTCE General Knowledge Mathematics practice test.
- "Which inequality represents the graph provided?" Well the first thing you notice is that there's no intervals given, there's no tick marks or scale on either one of the axes. But that's actually okay because that's not what the question is asking us. They are telling us already that it's gonna be the line y equals two x. What they're asking us to determine is how the dashing occurs or how that relates to the equation, and also how the shading relates to the equation, I should say inequality.
So to begin with this is a dashed line. Dashed line means we have a strictly greater than or strictly less than sign. I'm gonna cross out C and D because those are greater than or equal to, less than or equal to, those guys can't be it. Okay, so we've narrowed it down to A or B. And the way we can tell is by choosing a point that's in the shaded region and seeing if it's a solution to the inequality.
Now oftentimes people use the point zero zero but unfortunately we can't use zero zero here because zero zero is on that boundary line. So I'm going to pick another point that I'm sure is in the shaded region. I'm gonna pick three zero. Three for x, zero for y. You could pick any of the points that are in the shaded region but I chose that one. So I'm gonna plug that into my inequality, we'll check answer choice A. Is it true that my y-value is less than two times my x-value?
Is it true that zero is less than six? Yes, it works. What if I were to check B just to be sure? My y-value is greater than two times my x-value? No, zero is not greater than six. So that's how I can confirm that the correct answer choice here is answer choice A.