
Advertisement
FTCE General Knowledge Mathematics
This Test Tutoring Video provides an answer and explanation for Question 43 from our Version 1 Practice Test for FTCE General Knowledge Mathematics. It is part of our Free FTCE General Knowledge Mathematics Prep Course, which also includes longer "Core Videos" that go further in-depth and teach all the content knowledge you need for success on the exam.
Question 43 (V1)
Use the table below to answer the question that follows.
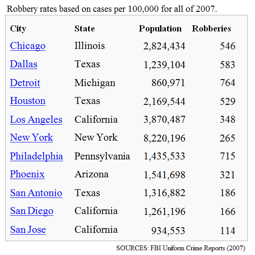
According to the table above, which of the following statements is true of robberies in 2007?
A. New York had more robberies than Los Angeles.
B. San Antonio had more robberies than Phoenix.
C. San Jose had the most robberies of the cities listed.
D. Dallas had 583 total robberies.
Answer & Explanation
Done watching this? Return to the course homepage to access your other free videos.
Return to Course HomepageAdvertisement
Video Transcript
Below is a full text transcript of our video above, which explains how to answer Question 43 from Version 1 of our FTCE General Knowledge Mathematics practice test.
Use the table below to answer the question that follows. We're given a table here with some robbery rates of different U.S. cities. And it says, according to the table above which of the following statements is true of robberies in the year 2007? Which is what the table represents.
Okay, before we get into the nitty-gritty of this table, it's important to understand that this is a very commonly misanswered question, and it's because people often times aren't reading the important fine print that we need to understand to interpret the data in this table correctly.
Whenever you come across a visual representation on the exam, be it a graph, chart, table, scale drawing, of any kind like that, the first thing you want to do is read the fine print, because often times there is some sort of scale involved or some sort of extra piece of information that is needed to interpret the data in that visual representation correctly.
So, let's take a closer look at this table and see where people often go wrong and how we can make sure that we don't make that same mistake. Okay, so if we look here at the table the important fine print that I care about, there's a couple different pieces of fine print here, but the one that's really important here is at the very top of the table. So hopefully, in taking the exam on the website you can read this clearly.
It says, robbery rates based on cases per hundred thousand people for all of 2007. What does that mean? Ok, take a look at the table. There are four columns: city, state, population, robberies. The most common misperception about this table is that this far right-hand column, the robbery column, is the total number of robberies in that U.S. city for the year. No. It is the robbery rate in that city.
This fine print here tells us that the column that really matters if I want to figure out the total number of robberies in a city, is population. Population matters. Ok? In other words, if it's based on cases per hundred thousand people, however many groups of 100,000 people there are in these cities, which are all very populous right? Many of them over a million some even multiple millions.
There's gonna be a need to multiply that by this robbery rate to get the total number of robberies in that city. Okay, so let's take a look at our answer choices here and see what the correct one is. If we read answer choice A it says, New York had more robberies than Los Angeles. So great let's compare them. They're right next to each other on the chart here. So I'm going to just draw some lines here to focus us in on these two cities. So here we have L.A. Here's New York.
If I'm looking at this table the wrong way, which is not taking into account the extra piece of information that's needed to interpret it, I'd see L.A.'s at 348 in the robbery column, New York's at 265 and I'd think, oh L.A. had more robberies than New York; A is clearly not the right answer. But no, what we're not taking into account there is the city's population. Look at the populations here. L.A. has a little less than four million people. New York has more than eight million more people.
So think about how many more groups of 100,000 people are in eight million versus say four million, right? That's more than double the population. Think about it like a common denominator in a fraction. We would then need to put these on a level playing field need to more than double this robbery rate to compare them on a level playing field. So if I take population into account, which the table says I must according to the fine print, New York did have more robberies than L.A. in 2007.
So A is our correct answer, okay? The most common wrong answer here I would say is D. Dallas had 583 total robberies. And you can see if I haven't read the fine print how that would be a compelling answer because here's Dallas and here's their 583, right? Dallas 583. But again this is not the total number of robberies in the city. There are 583 robberies in Dallas per 100,000 people in a city of 1.2 million people.
So I'd need to multiply this number by about 12 to get the total number of robberies, 'cause that's how many times 100,000 goes into 1.2 million. Ok, so again the correct answer here is A. New York did in fact have more robberies than Los Angeles and the key to unlocking this table question is reading the fine print and understanding that population matters.