
Advertisement
FTCE General Knowledge Mathematics
This Test Tutoring Video provides an answer and explanation for Question 39 from our Version 1 Practice Test for FTCE General Knowledge Mathematics. It is part of our Free FTCE General Knowledge Mathematics Prep Course, which also includes longer "Core Videos" that go further in-depth and teach all the content knowledge you need for success on the exam.
Question 39 (V1)
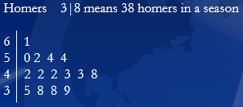
The following data represents number of home runs hit by Johnny Homer across 15 seasons of playing baseball. According to the Stem and Leaf Plot, what was the mode number of home runs he hit in a season?
A. 61
B. 45.5
C. 42.5
D. 42
Answer & Explanation
Done watching this? Return to the course homepage to access your other free videos.
Return to Course HomepageAdvertisement
Video Transcript
Below is a full text transcript of our video above, which explains how to answer Question 39 from Version 1 of our FTCE General Knowledge Mathematics practice test.
1 - The following data represents the number of home runs hit by Johnny Homer across 15 seasons of playing baseball. According to the stem and leaf plot, what was the mode number of home runs he hit in a season? Okay, so let's review what a stem and leaf plot means. Across the far left, we have these vertical numbers: six, five, four, three, those are called the stems. And then out to the right of those, we have the leaves.
And there's a key in the upper corner that tells us three dash eight, or three, vertical line, eight. Means 38 homers in a season. And so that's how we can interpret this. Like, the highest number this person hit was six, vertical line, one, which is 61. The lowest number looks like three vertical line, five. So, 35. And we can see all the numbers in between. Now, it's asking us for the mode, not the mean, not the medium. It's asking us for the mode. So, be careful with that.
The mode means the most often occurring number. So you could list out all 15 numbers, representing his 15 numbers of home runs for his seasons, or you could look for the number in the diagram, that shows up most often, which, in this case, is that 42. If you look, there's four, vertical line, two two two. And that shows up three times. There's no other leave that shows up three times. So, our mode, our most often occurring number of home runs, is answer choice D, 42.