
Advertisement
FTCE General Knowledge Mathematics
This Test Tutoring Video provides an answer and explanation for Question 40 from our Version 1 Practice Test for FTCE General Knowledge Mathematics. It is part of our Free FTCE General Knowledge Mathematics Prep Course, which also includes longer "Core Videos" that go further in-depth and teach all the content knowledge you need for success on the exam.
Question 40 (V1)
Use the graph below to answer the question that follows.
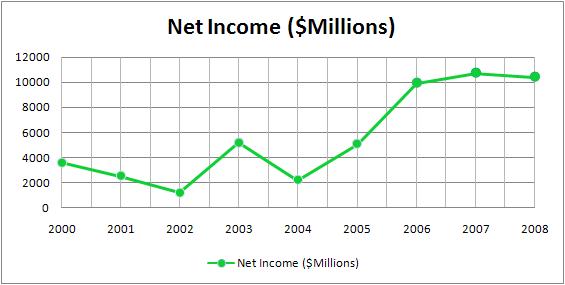
The graph above shows the net income of Chase bank from the year 2000 to the year 2008. Between which two years did Chase experience the greatest increase in net income over the previous year?
A. 2001 and 2002
B. 2002 and 2003
C. 2005 and 2006
D. 2006 and 2007
Answer & Explanation
Done watching this? Return to the course homepage to access your other free videos.
Return to Course HomepageAdvertisement
Video Transcript
Below is a full text transcript of our video above, which explains how to answer Question 40 from Version 1 of our FTCE General Knowledge Mathematics practice test.
- Use the graph below to answer the question that follows. We're given a line graph here, that we'll look at more closely in a second. The question that follows reads, "The graph above shows the net income of Chase Bank "from the year 2000 to the year 2008.
"Between which two years, did Chase experience "the greatest increase in net income, "over the previous year?" So, what we're gonna need to identify here, we're gonna have to go into the line graph, look at the values for each of the different years, and we're looking for the greatest increase in net income. So, we're looking for in a two-year period, from one year to the next, where did the values go up, by the greatest amount?
So, let's take a closer look at the line graph, and pull out the appropriate values, so that we can compare, which is the largest net increase in dollars. Okay, so, one thing we don't wanna do when we look at this graph, is to just eyeball what the answer might be. But, we can eyeball what the best choices to pull out the actual data are. So, if I look at this graph, there are clearly two large spikes upward in the graph. You can see those here, from 2002 to 2003, and here, from 2005 to 2006.
What I don't wanna do is make a value judgement about which of these is the greater dollar increase in revenue, just looking at the lines themselves. What I need to do now, that I've narrowed it down, looking at the visual representation of the line, is now, pull out the actual data points, to compare those numeric values, to get an exact comparison between these two contenders for the right answer. So, let's take a look at where the values are at.
Let's make a little bit of a chart here since we've narrowed it down to two. We'll call this side over here, from '02 to '03, there's one great increase on the graph, and on the other side here, we have '05 to '06, and let's compare those numeric values. So, the good thing that we know here, because it's a multiple-choice test is, we can approximate the values. I don't need to find in this question, what the exact difference in net income between 2002 and 2003 is.
I just need to have a general number, so that I can compare it to these two years over here. So, looking here at 2002, it looks like this data point, is a little bit more than halfway between the zero and 2000. So, nice round number I'd approximate that value to about 1,500. Okay, spikes upward here in '03. Looks like that data point is approximately halfway between the four and the 6,000. So, I put down 5,000 as an approximation for the values, of net income in 2003.
We'll do the same thing now for the values in '05 and '06. In '05, it looks like, pretty much at the exact same point, we were in '03, so I'm gonna use the same number there to be consistent, and say that it is about 5,000 in net income. And then, in 2006, looks like we're right here on the line of 10,000. Okay, now that we have first narrowed it down to the two best contenders for the greatest increase by eyeballing it.
Now, we have the actual numeric values to compare and what we care about, what's really important here is, how to compare the numbers. They wanna know the greatest increase in net income, so that, in other words means, where's the greater dollar increase between years. So, when it went from 5,000 to 10,000, it went up by 5,000 in profits. And over here, from '02 to '03, 1,500 to 5,000, it's going up by 3,500.
So, clearly, the greatest increase in net income, is happening over here, in the '05 to '06 range. So, our correct answer here is going to be C, 2005 and 2006.